
Table of Contents
Key Performance Indicators (KPI) are crucial indicators of progress towards a goal. These provide a focus towards strategic or performance improvements and can help focus attention on what matters more. Organizations use these indicators at multiple levels to evaluate their success at reaching targets. The use of KPIs involves setting targets and tracking the progress against those targets. However, setting good KPIs is crucial. A KPI needs to relate to a key business objective as it is integral to the organization’s success.
A well-defined KPI helps:
- Provide evidence of progress
- Measures what needs to be measured for better decision-making
- Offers a comparison
- Helps tracks efficiency, quality, resource utilization, and overall performance
Moreover, there are different types of KPIs divided into different categories:
- Inputs- measure attributes of resources consumers in the process of creating outputs
- Process- measure the efficiency, quality, or consistency of specific outputs.
- Outputs- show how much work is done and what is produced
- Outcomes- focus on accomplishments or details
- Project- focus on deliverables from any major improvement or initiative
To do well, every organization needs to have strategic and operational measures. Strategic help track progress toward your strategic goals and operations are focused on operations and tactics and help with day-to-day decisions.
KPI tools and dashboards
What is even more important is the ability to measure your KPIs and the progress you are making. KPI reporting tools should be on the top of your list as by utilizing a professional KPI dashboard, you can easily make sure your organization is staying on course. Such tools help you visualize and interact with data, perform complex analyses, share reports, and utilize predictive analytics. In a nutshell, they teach you how to measure SEO success.
A KPI dashboard software is a management tool that provides a view of the businesses’ performance. There are numerous tools out there, and we will list the top 12 KPI dashboards and tools we think you should check out.
1. Reportz
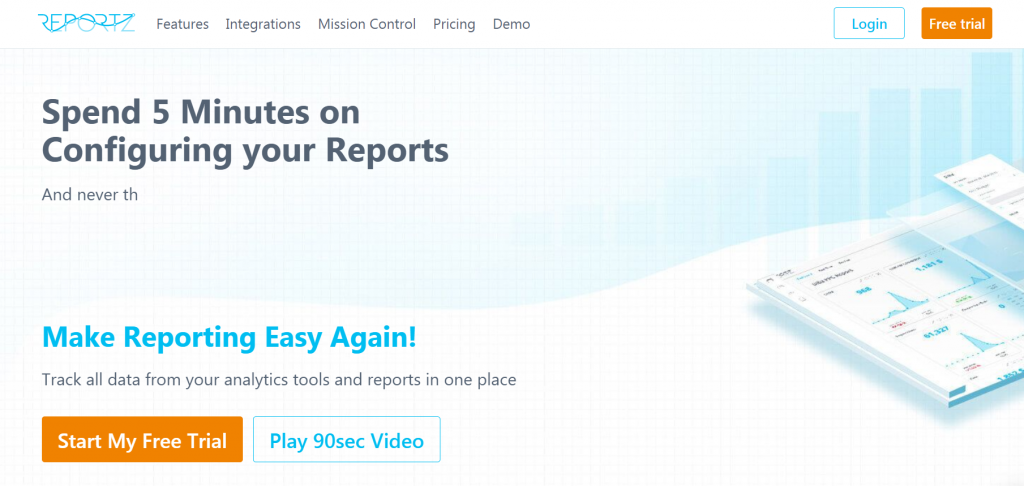
Reportz is a fully customizable KPI-based reporting tool. It will provide you with real-time data from all of your marketing channels. You can set up a white-label dashboard and share it with clients and team members so everyone gets good insight into the company’s operations. The reports can be automated, and you can add as many users for better collaboration and efficiency.
The reports you provide can be customized, and you can decide which metrics are relevant to be shared with others. To make it even easier, there are pre-made templates you can use for SEO, PPC, social media, and e-Commerce, but you can still edit them and make sure they fit your company.
You can even connect with Google Analytics, social media, Semrush, WooCommerce, and Salesflare. You can get this tool for only $69 in the form of a one-time purchase, which puts it in the category of more affordable KPI dashboards.
2. Scoro
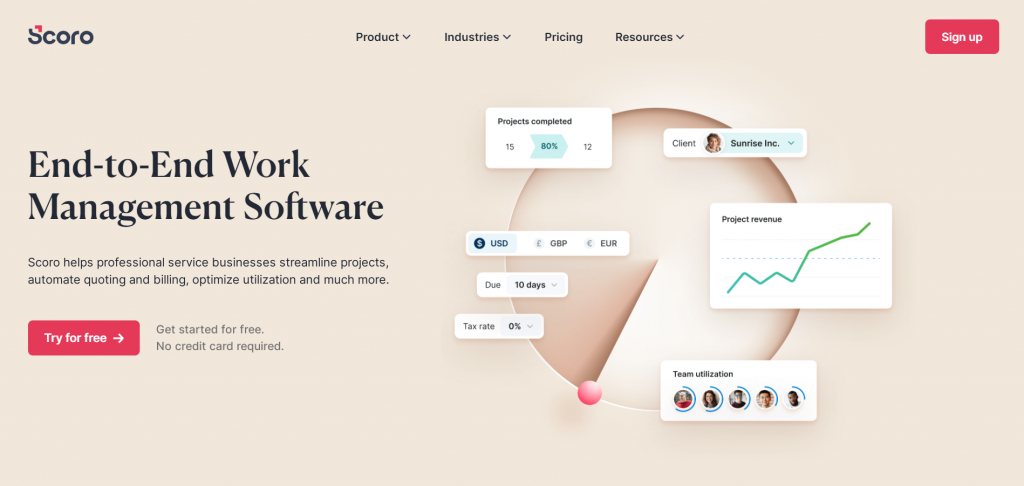
Scoro is another KPI dashboard software that lets you oversee your company on several dashboards in real-time. You can integrate it with your current software so you can monitor all of your data in one system. You can track different projects, budgets, sales, forecasts, and performances and customize your dashboard with additional widgets and metrics. You can compare trends and set permissions to limit access to some information. To get this tool, you pay a monthly fee of $26 per user.
3. Datapine
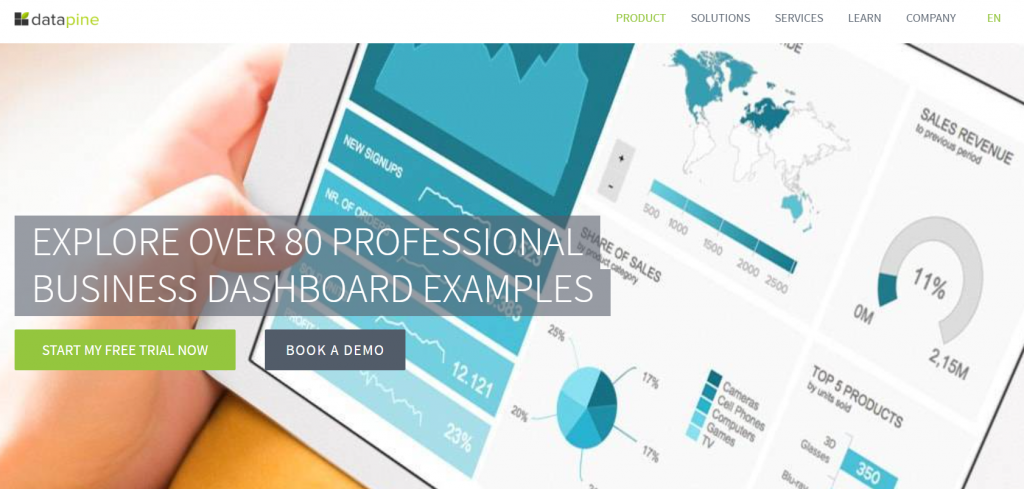
Datapine is a tool that lets you monitor your most important metrics. You have access to advanced analytics, automated reporting, interactive dashboards, and custom formulas. The tool is great for helping you discover trends and relationships so you can decide based on real data and facts, not guesses.
There are different dashboards you can use, which are divided into different functions (marketing, finance, or sales), industries (healthcare, logistics, and retail), and platforms (Facebook, YouTube, Google Analytics).
Also, you can share your dashboard and reports for better collaboration. However, this tool belongs to a pricier range of tools, starting at $249 per month as well as paying $55 per user per month.
4. InetSoft
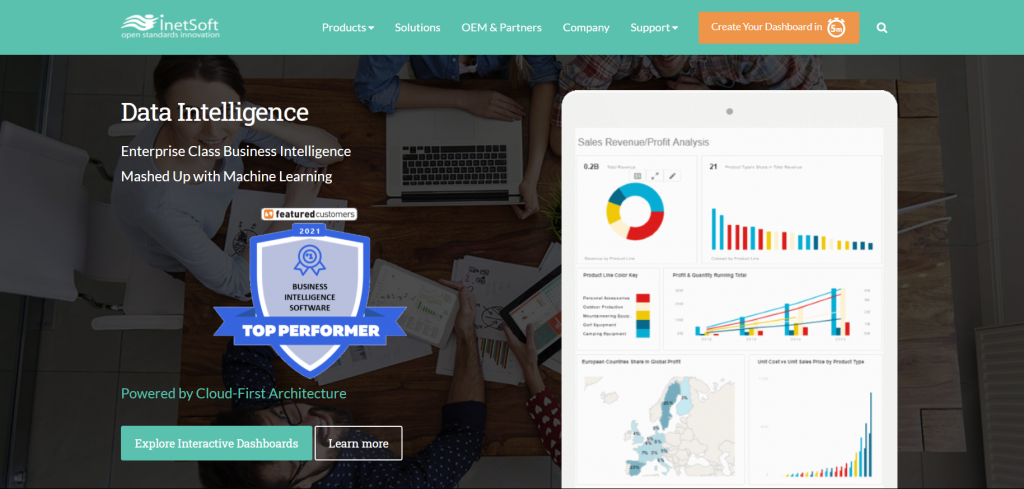
InetSoft is a powerful data mashup software. You can easily transform data and make it visual to understand what’s going on more easily. InetSoft uses business intelligence and machine learning to extract value from your data and is powered by flexible data mashup technology. This is further integrated with machine learning abilities that enable report creation and make it simple to use. You can style and personalize your reports, create charts and tables, and the tool is designed to be responsive and web-based so it will adapt to all devices.
5. Tableau
Tableau is a popular analytics platform that helps people understand data. It is tailored to fit your team as creators can build analytical content, explorers can access and analyze the data, and viewers can interact with visualizations and dashboards. It is easy to use, has a range of data exploration tools for analysis, and can be integrated with additional tools, from Google Analytics, SQL Server, SAP, Salesforce, and many more.
You have access to different data science integrations for better predictive modeling, dashboard integrations to interact with data, and embedded analytics.
6. SimpleKPI
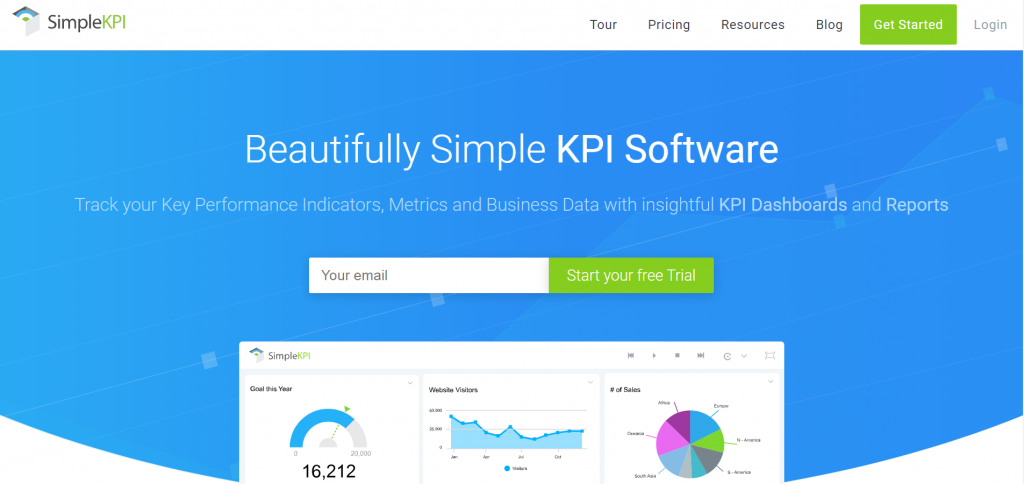
SimpleKPI creates powerful and flexible dashboards. You can edit and customize your reports, share them, and use analytics to analyze your data. This tool is simple to manage and visualize. You have real-time monitors for reports, you can track different departments and individuals, and use additional tools for better data organization. You can create formulas to perform calculations of your KPIs, collaborate, add unlimited users, and use pre-defined templates. Also, you can customize and export your reports and integrate them with other tools for better performance.
7. Smartsheet
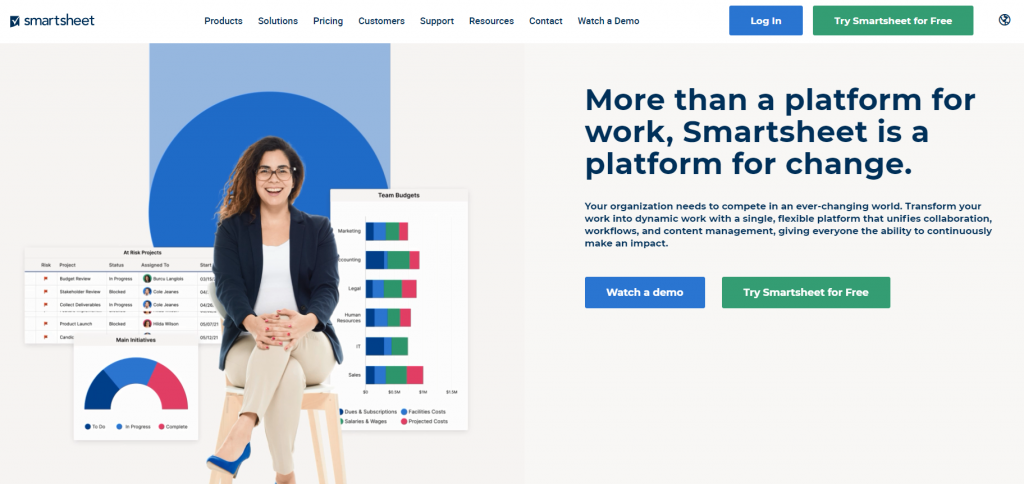
Smartsheet is a tool that links well with other apps such as Tableau, Excel, QlikView, and others that help you create data visualizations and present insights easily. As with most other tools, you can easily share data, collaborate, set automated reminders, and get report summaries. It also provides access to different templates, add-ons, and integrations (Slack, Microsoft Teams, Hangouts, etc.) to make your work easier.
8. Bilbeo
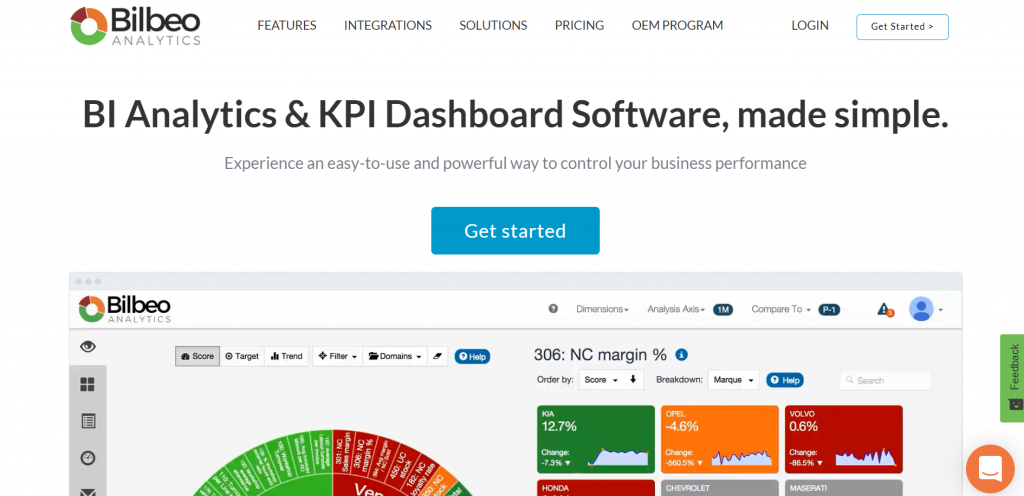
Bilbeo uses different scoring and advanced data visualization features to help you automatically populate your business dashboard. Other features include smart alerts, leading indicators that drive your performance, customer reports, and an unlimited dashboard. You don’t need to do any setting up or designing but can go straight into providing reports.
You can easily monitor the performance of your KPIs and identity bottlenecks that need to be fixed. Also, you will get smart alerts whenever something needs to be fixed. Lastly, you can pick from several different pricing plans depending on your needs, starting at $39 for 2 users.
9. Target Dashboard
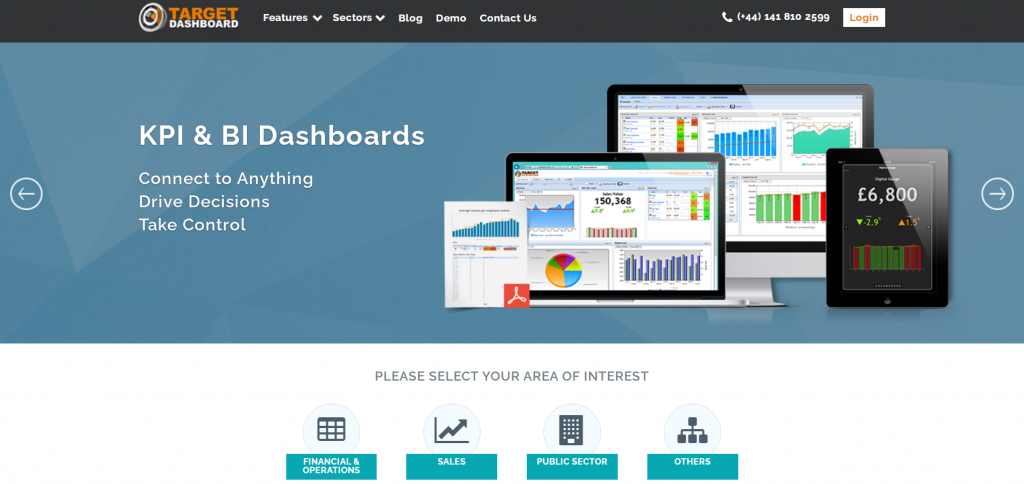
Target Dashboard focuses on making your report creation process easy. You can connect and mix all of your data in one location from different sources, share it with other users, and further summarise data to make it easier to report. The reports you make and create are specified for your industry and are cloud-based. It is effortless to manage and is run fully online, which means low maintenance, so you can divert your attention to your KPIs.
10. Databox
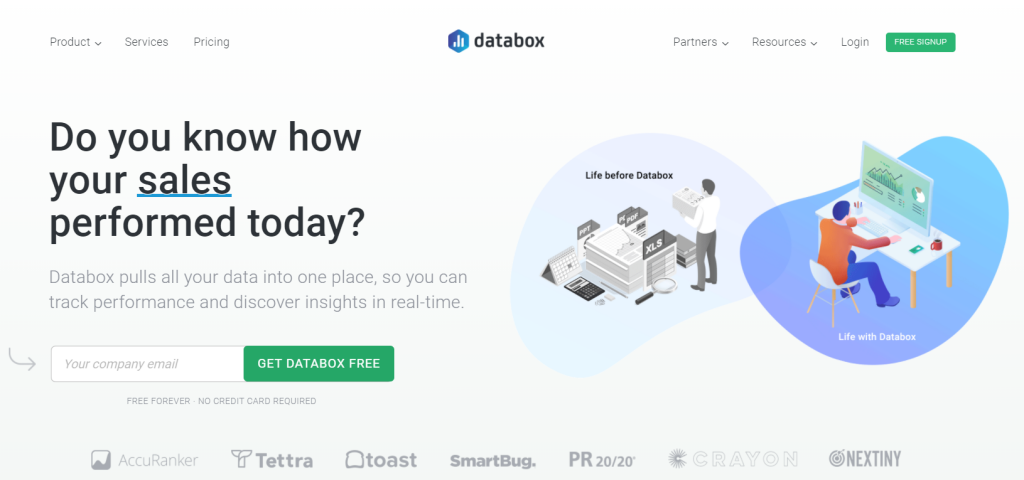
Databox has many features, but the most important ones would be setting time bounds, numerical goals and automatically tracking your progress. There are more than 70 integrations that help you track your goals. Also, you can create very visual reports with no coding required, and it comes with a mobile app. This tool is free for up to 3 users. You can mix your data to create relevant reports easily and directly from your dashboard. There’s even an option to see your historical data and set up alerts.
11. InfoCaptor
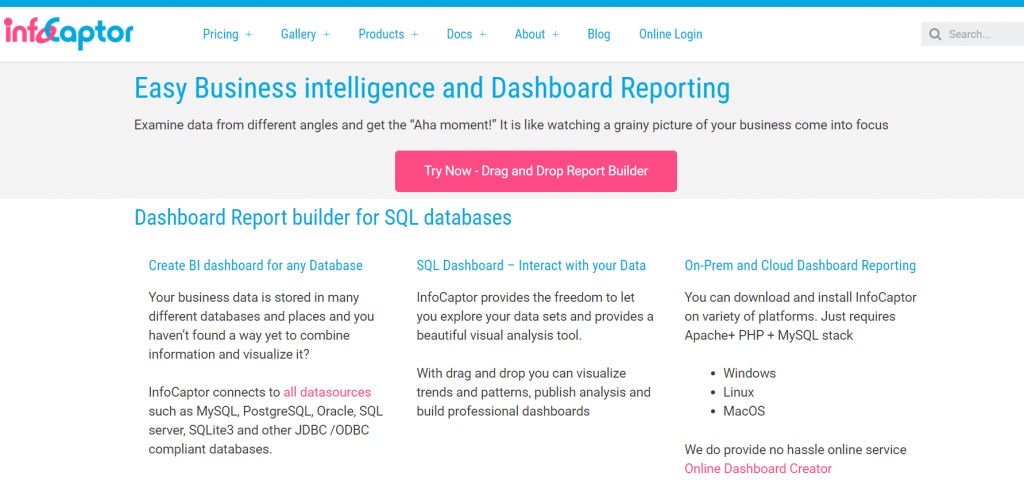
InfoCaptor is great for analyzing data from different angles. You have access to rapid analytics, ad-hoc visualization, prototyping mock-ups, and security and data governance. You can also connect different data sources from MySQL, PostgreSQL, Oracle, SQL Server, and many more. You also get Business Intelligence and Analytics for WooCommerce as a WP plugin so you can install all of your important metrics into comprehensive dashboard reports and transform complex data into great visualizations.
12. Grow
Grow is a reporting and BI software designed to help you connect data by using integrations, databases, and CRMs. You can pick the data you need to create charts and reports, as well as use the Grow timer to refresh your data. You can create a variety of charts, dashboards, and metrics. To make the whole thing simpler, both data and reports can easily be shared with the rest of the team for better collaboration. If you’re unsure about something, consult their live demo that can help you build your dashboards and reports so you can start measuring your performance.
FAQs

Why use KPI tools?
KPIs are a crucial part of ensuring your company stays on track. Your KPIs let you stay on track and measure progress so you can see reports on what needs to be optimized.
What are KPI tools?
KPI tools are a business reporting solution used to track and monitor key performance indicators specific to your company’s business objectives.
What makes a good KPI tool?
A good KPI tool will allow you to generate different reports, visualize them for better understanding, and mix and use various data to present the most relevant findings for your company’s business objective.
Do I need to have specific knowledge to use KPI tools?
No, there is no specific or coding knowledge required to use KPI software. Everything is done from your dashboard, so you just need the ability to analyze the data and present it in a visual way that makes sense.
Is KPI all I need?
Some KPI software might only offer a fraction of the functionality you need. Consider getting more robust tools with data mining and analytics capabilities to create the most relevant reports and analyze data that will show you where your business is in terms of its goals and objectives.
Conclusion
We hope you found this article useful. Having a way to track your progress and KPIs is very important. However, we would like to highlight Reportz as the tool we would recommend you use. It offers a wide range of features at a low price, so if you are unsure which tool to get, we suggest Reportz.